Cyclomatic Complexity: What the Score Actually Tells You
Summary
Cyclomatic complexity counts the independent paths through a function: each if, loop, and case adds one branch. NIST caps it at 10 per function, but a flat threshold misleads without a second signal like change frequency. This guide covers the formula, the real-world risk bands, four tools that compute the number, and three refactoring moves that lower it without hiding the logic in nested helpers.
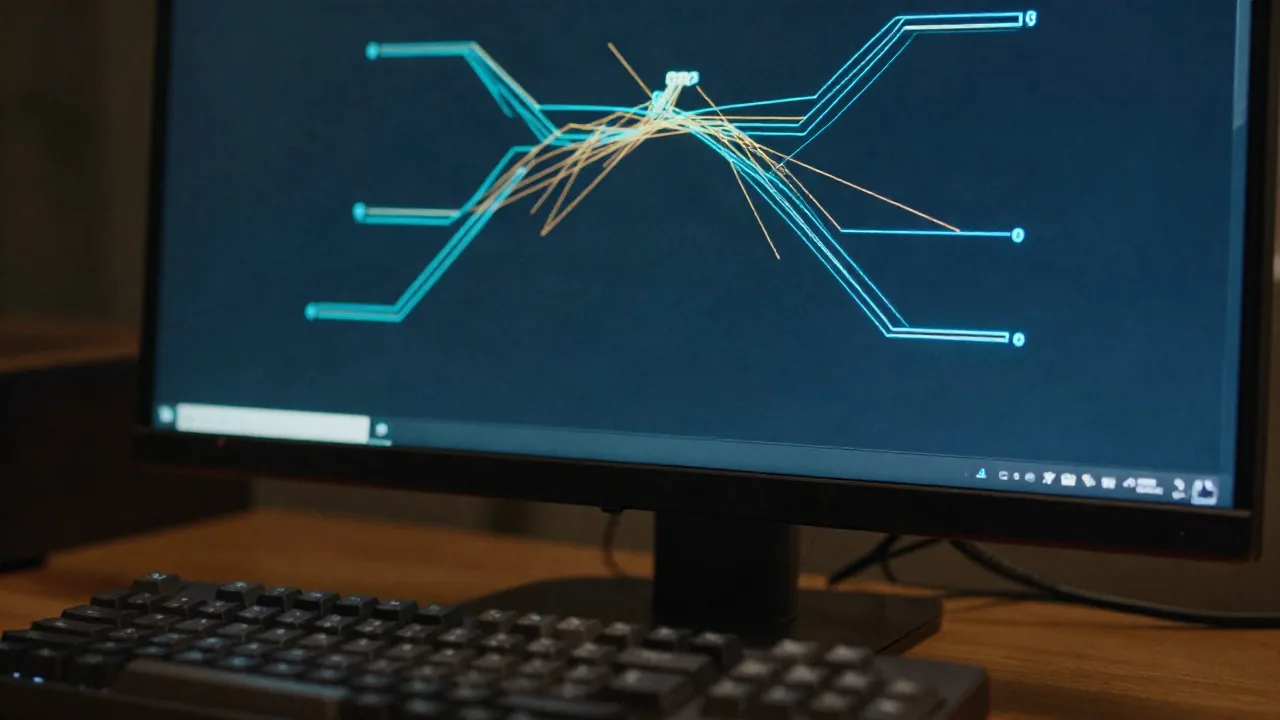
Cyclomatic complexity counts the number of independent paths through a function: every if, for, while, case, and catch adds one branch to the total. A function with a score of 1 has no branching at all, one straight line from entry to return. A function with a score of 25 has 25 distinct routes execution can take, and 25 distinct routes a test suite would need to cover to call itself complete. NIST puts the ceiling at 10 per function. Most teams never check.
How the Number Gets Calculated
The formal definition is M = E − N + 2P, where E is edges in the control-flow graph, N is nodes, and P is connected components. For a single function that simplifies to M = E − N + 2, which is a graph-theory way of saying: count the decision points, add one.
You rarely need the formula by hand. Any linter or static analyzer walks the AST, counts if/else if, while, for, case, catch, and boolean operators like && and || inside conditionals, and adds 1 for the function's single entry point. The boolean operators matter more than people expect: if (a && b) is not one decision, it's two, because a and b are each independently capable of sending execution down a different path. A ten-line function with three nested conditionals and a couple of && chains can hit 6 or 7 before you've written a single loop.
// cyclomatic complexity: 7 (four if-branches + two boolean operators)
function classify(user) {
  if (user.ageGroup === 'child') return 'child';
  if (user.ageGroup === 'teen' && user.hasParentalConsent) return 'teen';
  if (user.region === 'EU' || user.region === 'UK') return 'gdpr';
  if (user.isBanned) return 'blocked';
  return 'standard';
}
That function reads fine on a screen. It still needs 7 test cases to claim full path coverage, and most test suites stop at 2 or 3: the happy path and maybe one edge case. The gap between "looks readable" and "is actually tested" is exactly what the number is measuring.

What Counts as Too Complex
The industry has more or less converged on four bands. 1 to 10 is low risk: easy to test, easy to hold in your head while reading a diff. 11 to 20 is moderate: still testable, but the branch count means your suite needs real coverage, not a happy-path check. 21 to 50 is high: hard to test thoroughly, and a strong candidate for a split before the next feature lands on top of it. Past 50, the risk is severe enough that most teams treat the function as a rewrite target, not a refactor target (Sourcegraph's breakdown lays out the same four bands with the NIST citation attached).
10 is the number worth remembering. It is old (McCabe proposed it in 1976), it is conservative, and it still holds up decades later as a CI gate: below 10, defect density stays low across most of the codebases studied since. Above it, defect rates climb fast enough that "we'll fix it later" rarely happens, because the function keeps growing new branches faster than anyone circles back.
None of this means every function above 10 is broken. A switch statement mapping 15 enum values to 15 labels can score north of 15 while being safer than a 4-branch function tangled with side effects. The number measures path count, not danger. Read it as a prompt to look closer, not a verdict.
Does a High Score Actually Predict Bugs?
The original 1976 McCabe paper and the studies that followed it consistently found a correlation, not a guarantee: functions above the threshold get more defects per line, on average, across large samples. Average is the operative word. Any individual function can buck the trend in either direction.
What the correlation is good for is triage, not judgment. If a bug report points at a file and you're deciding where to start reading, the function with a complexity of 34 is a better first guess than the one at 4, purely on the base rates. It's a way to spend your limited attention where the odds favor finding something, not a scorecard to wave at a teammate during review.
Cyclomatic Complexity vs. Cognitive Complexity
A related metric, cognitive complexity, was built specifically to patch the gap the GetDX critique above points at. Cyclomatic complexity counts every branch equally: an early guard clause at the top of a function costs the same as a branch buried inside three layers of nesting. Cognitive complexity weights nesting depth, so the buried branch costs more, because it actually is harder to hold in your head while reading.
The two numbers frequently diverge on the same function. A long chain of flat if/else if statements checking the same variable can carry a high cyclomatic score and a low cognitive score, because nothing nests. A short function with two deeply nested loops can carry the opposite: a modest cyclomatic score and a cognitive score that flags it as genuinely hard to read. SonarQube computes both side by side for exactly this reason. If your linter only reports one, cyclomatic complexity is the one you'll find everywhere, but cognitive complexity is the one that better matches what a reviewer actually experiences opening the file.
Skip: Treating One Global Threshold as Gospel
Here's the differentiator most complexity write-ups skip: a flat threshold of 10 across an entire codebase is a blunt instrument. A 40-line state machine with a dense switch and a 40-line function with the same score but five levels of nesting are not equally risky, even though the number is identical. Cyclomatic complexity counts paths, not depth, not variable scope, not how far apart a branch and its matching closing brace sit on the page.
GetDX's critique makes the sharper point: teams that chase a lower score in isolation sometimes make code worse, not better, by flattening logic into deeply nested helper calls that hide the branching instead of removing it. The structural number goes down. The cognitive load required to trace what the function actually does goes up. If you're optimizing for a metric instead of for the person reading the diff in six months, you've picked the wrong target.
The fix isn't to ignore the metric, it's to pair it with a second signal: how often the file actually changes. A complex function that hasn't been touched in two years is a curiosity. A complex function edited every sprint, by three different people, is a bug incubator, and that's the distinction a raw complexity score alone can't make.

The Tools That Actually Compute It
If you want the number without hand-counting branches, four tools cover most of the ground, each with a different angle on the same underlying metric. Picking between them comes down to one question: do you want the number in a CI gate, in a trend line next to your commit history, in a native app you run offline, or as a comment on the pull request itself?
SonarQube tracks complexity per function and per file over time, and its quality gates can fail a CI build the moment a pull request crosses your threshold. The Community edition is free and self-hosted, covering the core static analysis. Cloud pricing scales with lines of code, which gets expensive on a large monorepo, and the defaults are noisy until you spend an afternoon tuning them.
CodeScene takes the pairing idea from the section above and builds a product around it. Its CodeHealth score blends complexity with how often a file changes, so a hotspot report tells you which complex functions are actually dangerous, not just which ones exist on paper. The trade-off: it wants git history, not a single snapshot, so first-run value is lower than a plain linter until it has a few months of commits to learn from.
Understand, from SciTools, is a native desktop app rather than a hosted dashboard: point it at a local checkout and read cyclomatic complexity, path count, nesting depth, and Halstead metrics in one Metrics Browser. Command-line automation is gated to specific license tiers, and the UI shows its age, but for C/C++ and embedded work it goes deeper than most web-based tools bother to.
Code Climate Quality is the fastest of the four to set up: point it at a GitHub or GitLab repo and it comments directly on the pull request the moment a function crosses your threshold. The free plan covers small projects; the Team plan starts around $16.67/mo. Per-repo pricing adds up if you run a lot of small tools, and the maintainability score is a blend rather than a raw cyclomatic number, so you dig one layer to see the metric itself.
A Terminal-Only Way to Check It
None of the above is required to get the number. lizard (Python, pip-installable, MIT license) walks a directory and prints complexity per function for C, C++, Java, JavaScript, Python, Go, and a dozen more languages, with zero config and zero network calls:
# no account, no upload, no dashboard: just the numbers
$ lizard --CCN 10 src/
  NLOC    CCN   token  function
    42     12    210   parseRequestHeaders@src/http.c
    18      4     88   normalizeUrl@src/http.c
========================================
1 function exceeds CCN 10pmccabe, older and C/C++-only, has shipped this exact measurement since the early 1990s at Hewlett Packard. Neither tool phones home. Neither needs an account. If your workflow is "check the number before I commit," a five-second terminal command beats opening a dashboard every time, and it works the same on a plane with no wifi as it does at a desk with a fast connection.

How to Bring a Score Down Without Making It Worse
Three moves account for most of the reduction you'll actually want, in order of how often they apply:
Early returns first. A function nested four if blocks deep almost always has the same logic available as a flat sequence of guard clauses that return early. The complexity number barely moves, sometimes it doesn't move at all, but the reading complexity drops hard, because you stop holding four levels of context in your head at once.
Extract the branch, not the whole function. Pulling one dense conditional block into its own well-named function takes that block's paths with it, lowering the caller's score directly. Do this for the two or three worst offenders, not for every if statement in the file; over-extraction just moves the branching into a maze of one-line functions that's harder to trace than the original.
Replace long if/else if chains mapping a value to an outcome with a lookup table or a switch. A ladder of eight else if statements checking the same variable against eight values is eight branches for the interpreter and eight branches for cyclomatic complexity. An object literal mapping the same eight values to the same eight outcomes is one lookup, and the complexity tool agrees.
Skip the refactor that only exists to satisfy a linter. If a function's high score comes from a genuinely irreducible decision tree, like a tax bracket calculator with eleven legitimate bands, don't scatter it across six files to dodge a threshold. Add a comment, add tests for every branch, and move on.
Order matters here more than people assume. Extracting first and adding early returns second usually leaves you with more, smaller functions that are each individually still tangled. Flatten the logic first with guard clauses, see what's left, and only then decide whether the remainder deserves its own function. Most of the time, half the original branches disappear before you extract anything at all.
Where This Fits a Native Toolchain
We're partial to the terminal-only path for the obvious reason: no telemetry, no phone home, no dashboard tab left open in the background. Run lizard --CCN 10 src/ in a pre-commit hook, and anything over the line fails the commit before it ever reaches a pull request. No dialog, no SaaS seat, no waiting on a CI job to tell you what a local binary could tell you in under a second.
That said, a pre-commit hook only catches new code. It says nothing about the 40,000-line file nobody has refactored since 2022. For that, a hosted tool tracking complexity trend over months earns its keep, even on a site that otherwise avoids anything that phones home.
Should You Gate Your CI On It?
Gate on 15, not 10. A hard fail at the textbook threshold turns into noise within a month, because plenty of legitimate code (large switch statements mapping enum values, validation functions with many independent checks) lives comfortably above 10 without being dangerous. Set the warning at 15, the hard gate at 25, and treat anything past 50 as an automatic refactor ticket, not a discussion.
Skip the temptation to run the check once and call the job done. Complexity creeps up one small commit at a time; nobody sets out to write a 60-branch function in a single sitting. A number checked at commit time and tracked over months catches the creep before it becomes a rewrite. A number checked once during a Q1 audit catches nothing except the mess that was already there.